Smoky Falls, Canada

A station with a temperature record spanning from November 1933 to December 1989 with a few years and months of data missing in between.
The raw data shows a warming trend of 0.38C/decade. But not content with sticking to the raw data, those bastard climate scientists came along and "adjusted" it in their figure fiddling ways.
They adjusted the data from 0.38C/decade warming to 0.32C/decade cooling.
Oh wait.
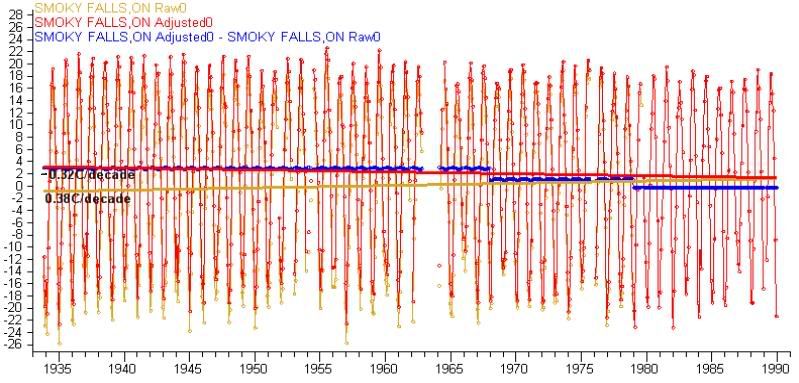
The adjustments are shown in blue. There are two large downward adjustments made. Both miss the large gap in 1963-1964.
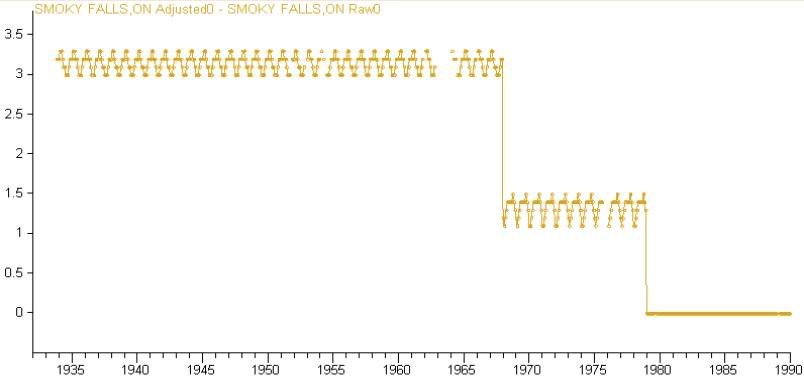
Here's the two downward adjustments up close:
I can't understand why these adjustments have been made, so obviously this must be evidence that global warming skeptics have hacked into the science databases and fraudulently altered the data to hide the warming.
They've even altered the NASA GISTEMP records of this station, adjusting past temperatures higher to turn strong warming into cooling. James Hansen is going to go mental when he hears about this:

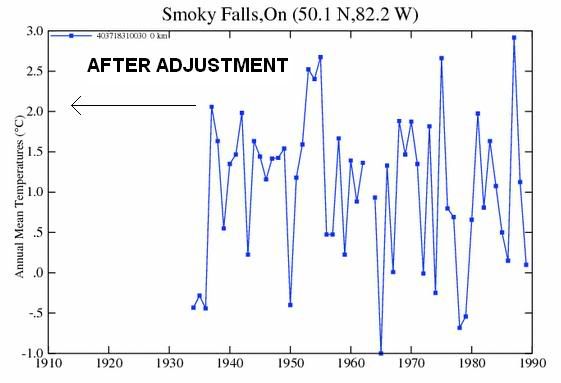
Note that the piddling 1.9C/century adjustment made at Darwin Zero is small fry compared to the massive 7C/century adjustment made here. If that matters.
Now that we have evidence "skeptics" have been manipulating the temperatures downward we should conclude that warming over the 20th century is probably larger than records indicate. Also send plenty of letters to your political representatives asking them to hold an inquiry into these spurious cooling adjustments. This is how Blog Science works isn't it?
Data for Smoky Falls exist, as well as for nearby stations like Kapuskasing. The fact that the GISS don't use them is at best sloppy science.
ReplyDeleteI mean up to date data, of course.
ReplyDeleteNo data for this station exists past 1989 in the GHCN database. That's in fact why GISTEMP doesn't use it.
ReplyDeleteThere are more extreme anti-Darwins than that. I'll pick out a couple when I get a chance.
ReplyDeleteJean: GISS doesn't make those decisions; they take whatever NOAA gives them. And NOAA takes whatever Environment Canada sends monthly CLIMAT reports for over the GTS. Doing a spot check, I don't see any recent CLIMATs for that station, but you can double check that.
Man, I need to write a program that does mapping, too. I'm entirely jealous. I'm assuming you didn't do it entirely from scratch - any pointers?
ReplyDeleteThis is BRILLIANT! I have no idea what any of it actually means. But it proves that global warming is a HOAX, correct?
ReplyDeleteYou have blue lines and everything.
Smoky Falls was the best anti-darwin I could find, although my search method was a little weak so I can imagine there are better anti-darwins.
ReplyDeleteThe mapping is easier than it looks. I am just taking a world map image, which I found on wikipedia (http://en.wikipedia.org/wiki/File:Equirectangular-projection.jpg) and drawing dots on top of it for each station.
If you have the ability to take a bitmap file and draw dots at specific pixel x,y coordinates then all you need to do is figure out which coordinates on the bitmap to plot the station.
Three factors make this easier:
-The world map image is equi-rectangular with no border padding, which means each unit of latitude and longitude are a constant distance in pixels.
-latitude 0, longitude 0 on the world map image is dead center of the image.
-The GHCN files already provide the station locations in decimal longitude, latitude.
Therefore the X and Y location to draw a station on the image is:
pixelX = bitmapWidth / 2 + (bitmapWidth / 360) * stationLongitude
pixelY = bitmapHeight / 2 - (bitmapHeight / 180) * stationLatitude
Ah, thanks. I could probably manage that. Sometime. There's a small army of people doing these sorts of projects now on GHCN (3, that I know of); I wish I had time now to write my own code and contribute as well.
ReplyDeleteOne minor nitpick- I think you should convert to anomalies for the trend analysis. There might be some end point effects because of the annual cycle. It's probably nothing to be worried about because the data spans such a large period.
ReplyDeleteCarrot eater ... for mapping (if you don't want to make it automatically, I reccomend Online Map Creation:
ReplyDeletehttp://www.aquarius.geomar.de/
It has the power of Generic Mapping Tools, but it is very simple to use it. Hope this helps
jon