
I also tested with the period 1980 to 2008 in case a lot of stations had simply not reported months yet for 2009, but I found that yielded 606 stations, just 6 more.
I did the same test for 2005 to 2009. There is a large gap in Africa and in Canada.
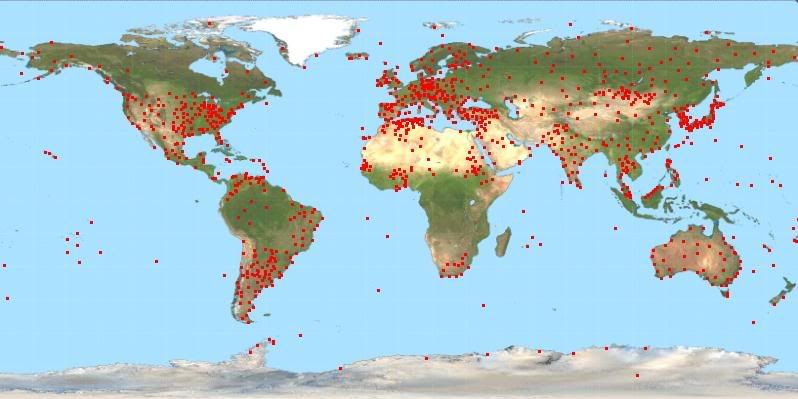
Defining years as having less than 7 months of data as invalid years, the below image shows stations with no invalid years in the period 1980 to 2009 in red. Stations with 1 invalid year in that period are shown in blue and stations with 2 invalid years are shown in orange.

Congratulations on the blog. I must say, you've written your code quite powerfully, such that you map and pick out desired subsets so easily.
ReplyDeleteThank you for acting on suggestions; I just suggested the 7 month bar completely arbitrarily, but I think it was educational to see. Allowing for one or two bad years picks up a decent number of stations.
I'm disappointed in Canada and Mexico. The Russians can maintain consistently operating and reporting stations across Siberia; what's with Canada?
Africa's even worse than I expected.
Still, for most regions one could work with only the stations identified above.
I see you were wondering about duplicate records in a previous post. If you want to use the NOAA or NASA as guides, I've seen that described in the papers. If you haven't seen that, let me know and I can find it pretty quickly.