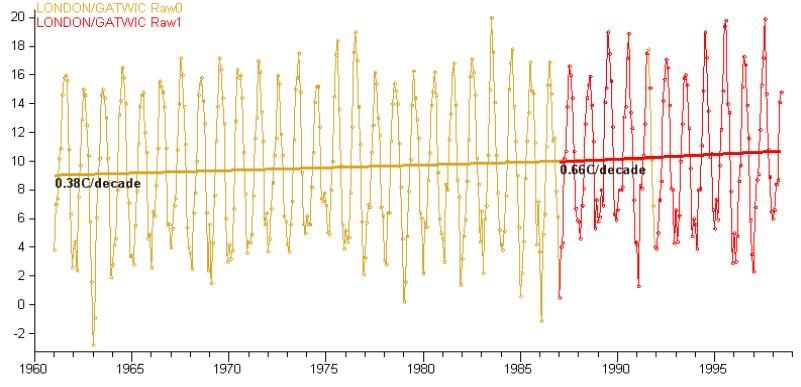
There are two raw duplicates. Duplicate zero spans 1961 to 1992 and duplicate one from 1987 to mid 1998, so there is some overlap. Both records show a warming trend:
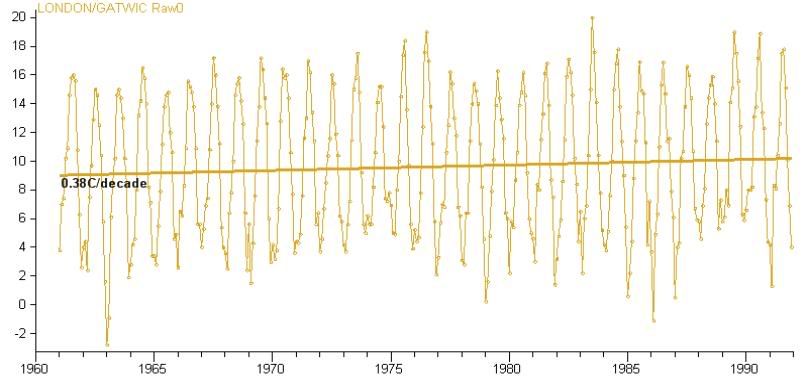
There is one adjusted record from 1961 to 1992:
Compare the duplicate 0 raw and duplicate 0 adjusted data:
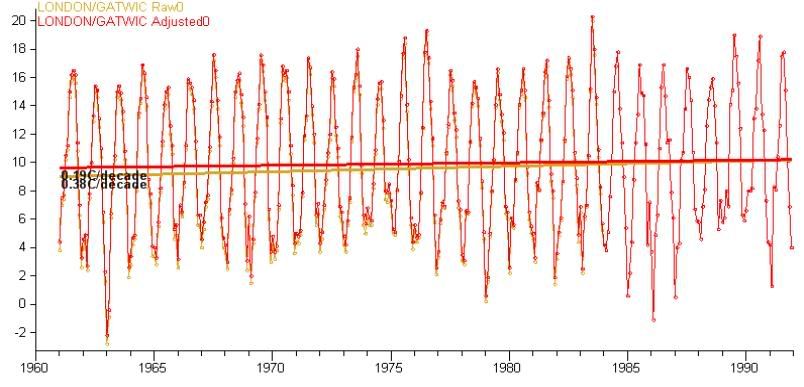
The adjustment has halved the warming trend over the period 1962 to 1991. From 0.38C/decade to 0.19C/decade.
The difference between the adjusted and raw record shows the pattern of the adjustments made:
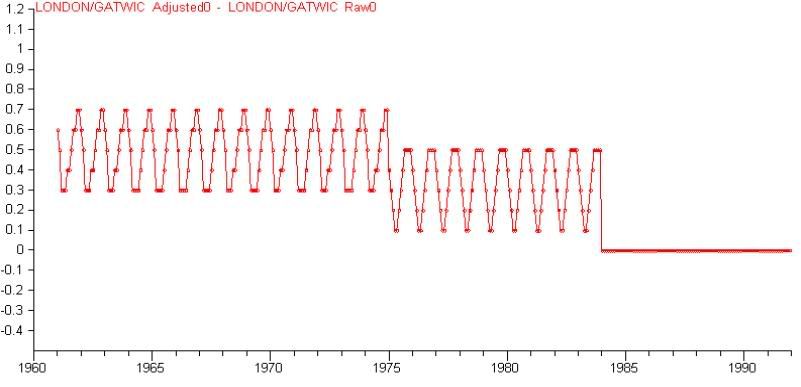
I don't know why these adjustments have been made, but this doesn't mean scientists must be fabricating the data to hide global warming. Gatwick was just something local I was looking at. It might be interesting to try and find the largest and weirdest downward adjustment in the GHCN record just to give the conspiracy theorists something to think about.
I haven't been working a lot on this in the past week. Added some stuff, but still haven't done anything insightful wrt analysis. What I have added is:
-Added the ability to calculate and plot a line of best fit over an entire record, or a subset of it.
-Added the ability to query for a list of all stations within a specified distance of another station.
-Added the ability to zoom in on the map, so that very close stations don't appear as a single dot.
-Added automatic colorization and key to the graph
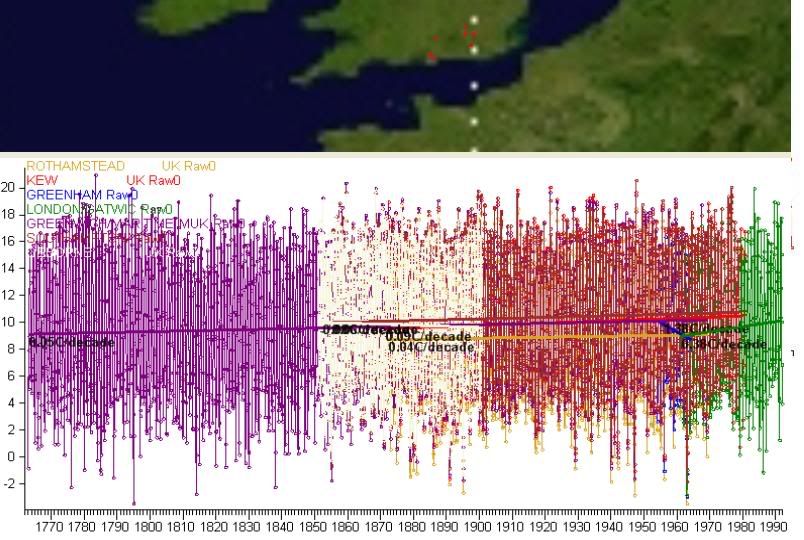
I used all this below to graph the first duplicate raw record of all stations within 100km of the Gatwick station as well as mapping the station locations. There are a number of graphical problems that make it unreadable, but this isn't too disimilar to the GISTEMP station selector if you pick numneighbours too high. I will just try to avoid plotting too much data at once in future.
No comments:
Post a Comment