Saturday, 13 February 2010

Smoky Fools

The Anecdote to the Smoking Gun at Darwin Zero

Smoky Falls, Canada


A station with a temperature record spanning from November 1933 to December 1989 with a few years and months of data missing in between.

The raw data shows a warming trend of 0.38C/decade. But not content with sticking to the raw data, those bastard climate scientists came along and "adjusted" it in their figure fiddling ways.

They adjusted the data from 0.38C/decade warming to 0.32C/decade cooling.

Oh wait.
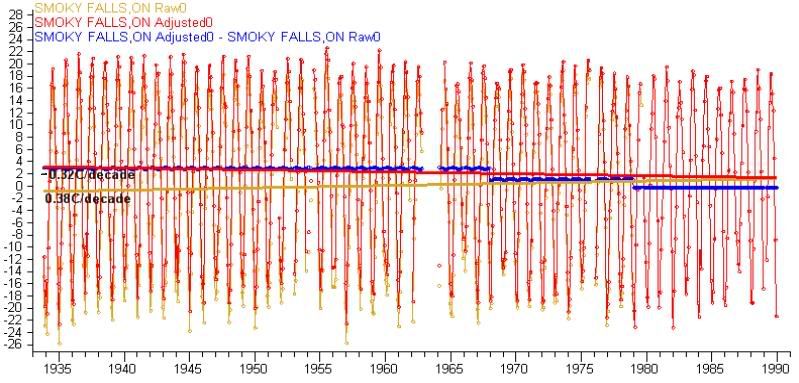


The adjustments are shown in blue. There are two large downward adjustments made. Both miss the large gap in 1963-1964.

Here's the two downward adjustments up close:
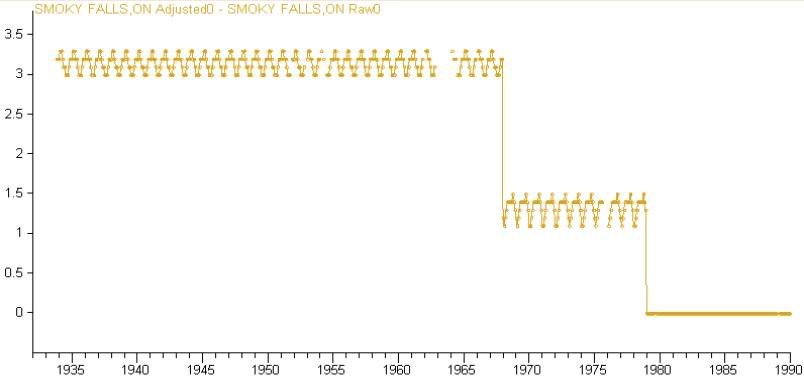


I can't understand why these adjustments have been made, so obviously this must be evidence that global warming skeptics have hacked into the science databases and fraudulently altered the data to hide the warming.

They've even altered the NASA GISTEMP records of this station, adjusting past temperatures higher to turn strong warming into cooling. James Hansen is going to go mental when he hears about this:

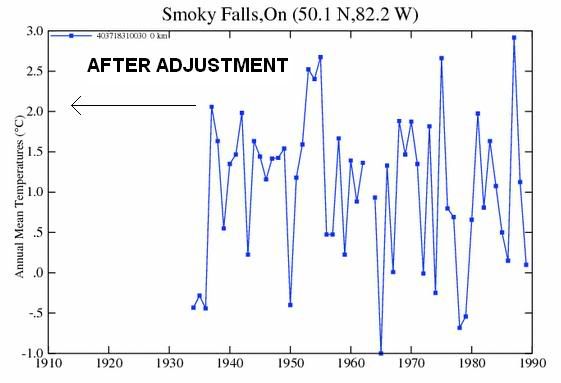


Note that the piddling 1.9C/century adjustment made at Darwin Zero is small fry compared to the massive 7C/century adjustment made here. If that matters.

Now that we have evidence "skeptics" have been manipulating the temperatures downward we should conclude that warming over the 20th century is probably larger than records indicate. Also send plenty of letters to your political representatives asking them to hold an inquiry into these spurious cooling adjustments. This is how Blog Science works isn't it?

Gatwick Zero

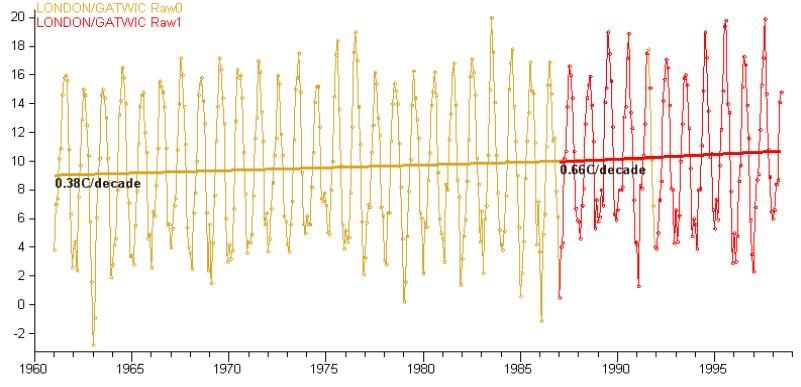
Gatwick Airport, London.

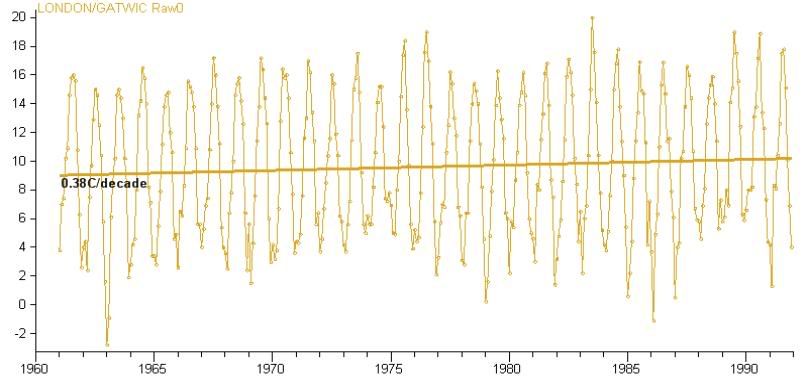
There are two raw duplicates. Duplicate zero spans 1961 to 1992 and duplicate one from 1987 to mid 1998, so there is some overlap. Both records show a warming trend:


There is one adjusted record from 1961 to 1992:


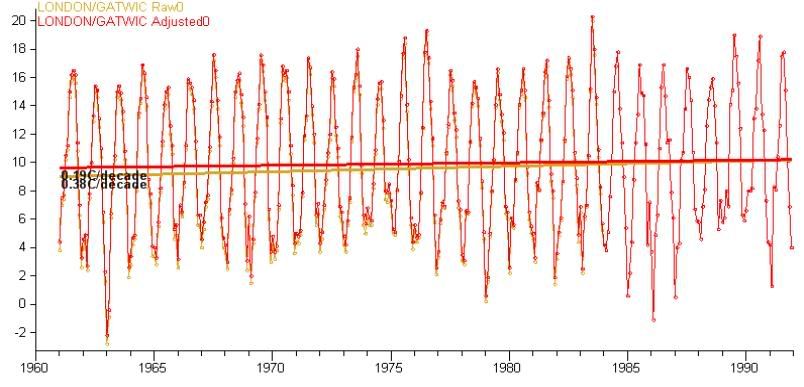
Compare the duplicate 0 raw and duplicate 0 adjusted data:


The adjustment has halved the warming trend over the period 1962 to 1991. From 0.38C/decade to 0.19C/decade.

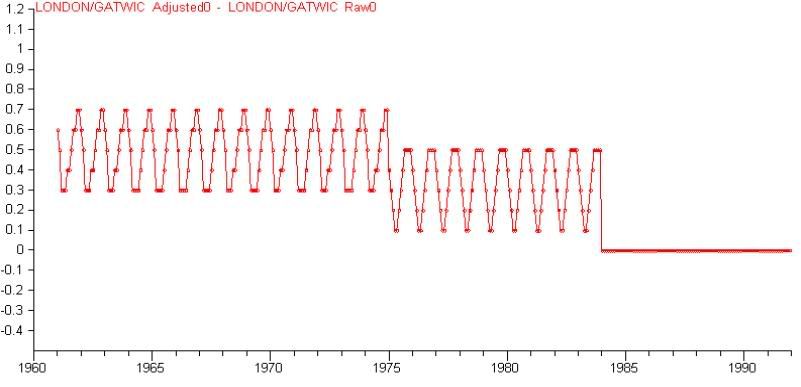
The difference between the adjusted and raw record shows the pattern of the adjustments made:


I don't know why these adjustments have been made, but this doesn't mean scientists must be fabricating the data to hide global warming. Gatwick was just something local I was looking at. It might be interesting to try and find the largest and weirdest downward adjustment in the GHCN record just to give the conspiracy theorists something to think about.

I haven't been working a lot on this in the past week. Added some stuff, but still haven't done anything insightful wrt analysis. What I have added is:

-Added the ability to calculate and plot a line of best fit over an entire record, or a subset of it.
-Added the ability to query for a list of all stations within a specified distance of another station.
-Added the ability to zoom in on the map, so that very close stations don't appear as a single dot.
-Added automatic colorization and key to the graph

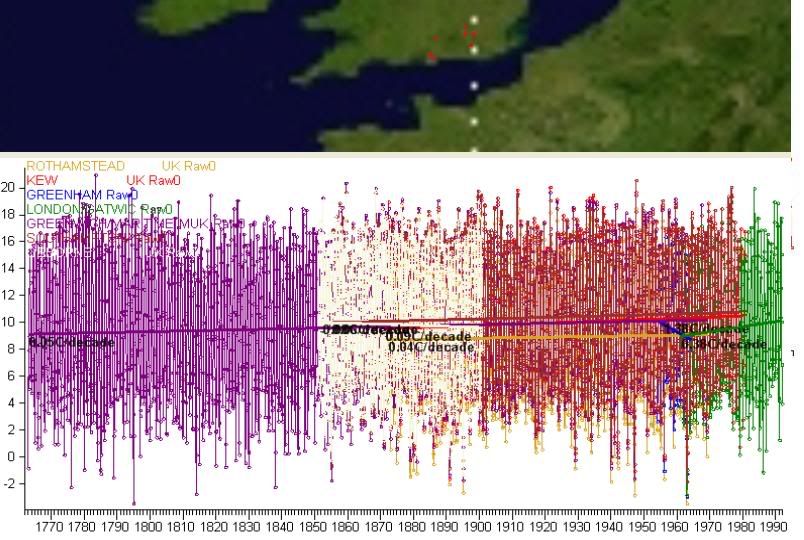
I used all this below to graph the first duplicate raw record of all stations within 100km of the Gatwick station as well as mapping the station locations. There are a number of graphical problems that make it unreadable, but this isn't too disimilar to the GISTEMP station selector if you pick numneighbours too high. I will just try to avoid plotting too much data at once in future.

Saturday, 6 February 2010

Derivatives & Differences

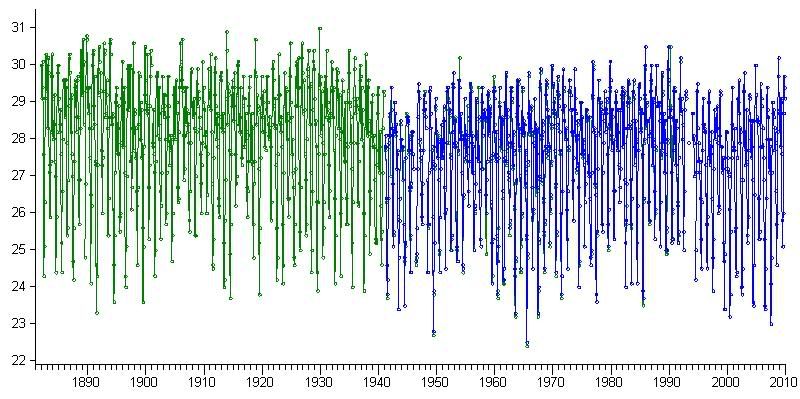
Slow going in the last few days as I had little time to work on the GHCN data. All I have done is add the ability to calculate the difference between two datasets. Eg Darwin, Australia raw record duplicates 0 and 1:


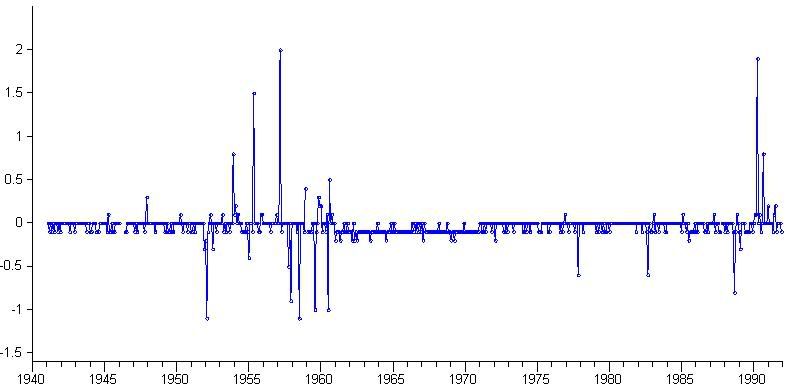
And their difference:


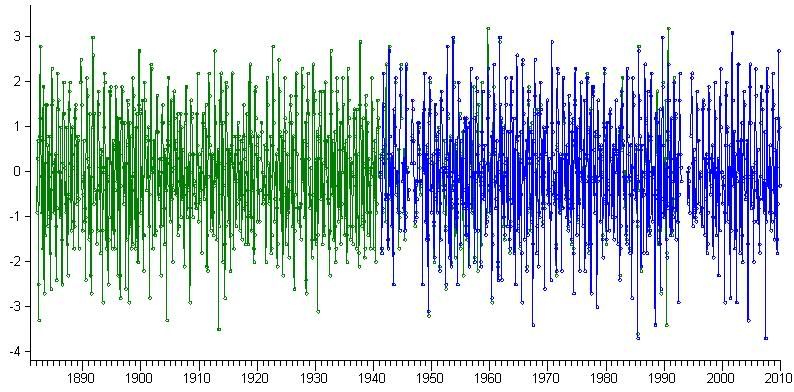
Also the derivative of each record:

Wednesday, 3 February 2010

Interesting

Two imminently interesting events are due.

First will be the release of the UAH satellite anomaly for January 2010 which should happen within days. I don't know for sure, but I suspect it will show a very high anomaly and as a result there will be a little pandemonium among leaders of the denialosphere as they have to scuttle around trying to align their treasured UAH satellite record with the "ice age" January they've all been reporting.

Of course the cold January was regional, not global and the UAH satellite record is not in lockstep with the surface. That's the answer. But these complexities wash over the heads of typical commenters on psuedoskeptic blogs. I also suspect this will act as a block against certain stories appearing in the denialosphere when GISTEMP et al publish not particularly cool global January anomalies. They can hardly complain about GISTEMP when UAH shows a higher anomaly. Who wants to bet they will complain anyway?

The second interesting and more important event is the launch of Cryosat-2, which according to wikipedia is scheduled for February 25th, 3 weeks time. The first Cryosat, if you recall, failed on launch and crashed in 2005. Pity it would have captured the 2007 arctic sea ice minimum and all if it had made it. Cryosat-2 has taken this long to build as a replacement. Anyway fingers crossed.

Frequent reporting stations of past 30 years

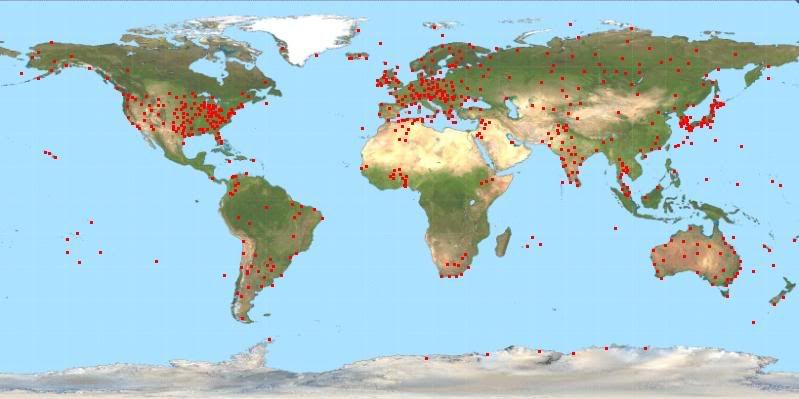
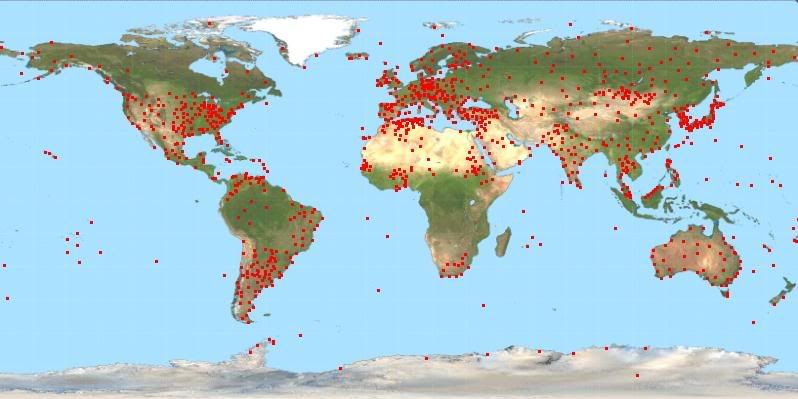
Map of all stations that have reported at least 7 months of each year during the period 1980 to 2009 inclusive. A nice round number, 600 stations:


I also tested with the period 1980 to 2008 in case a lot of stations had simply not reported months yet for 2009, but I found that yielded 606 stations, just 6 more.

I did the same test for 2005 to 2009. There is a large gap in Africa and in Canada.


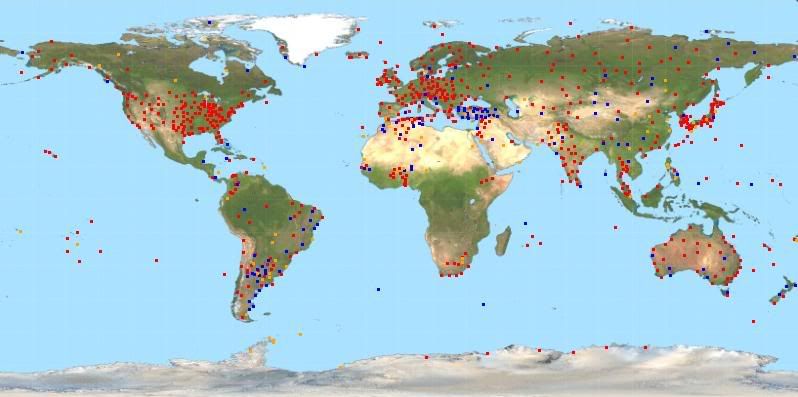
Defining years as having less than 7 months of data as invalid years, the below image shows stations with no invalid years in the period 1980 to 2009 in red. Stations with 1 invalid year in that period are shown in blue and stations with 2 invalid years are shown in orange.

Tuesday, 2 February 2010

GHCN Stations Still Reporting

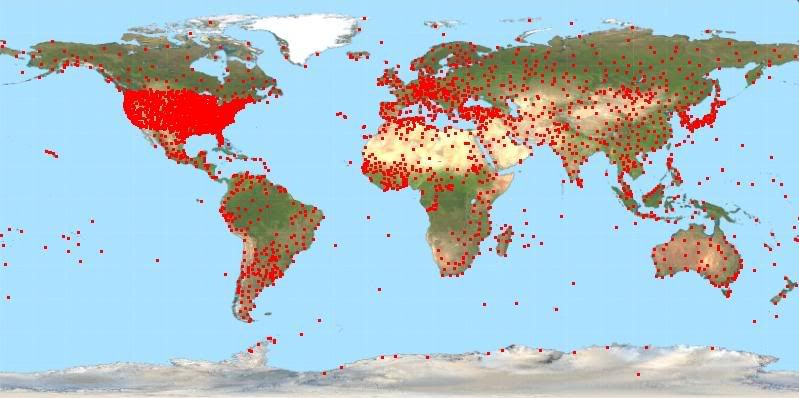
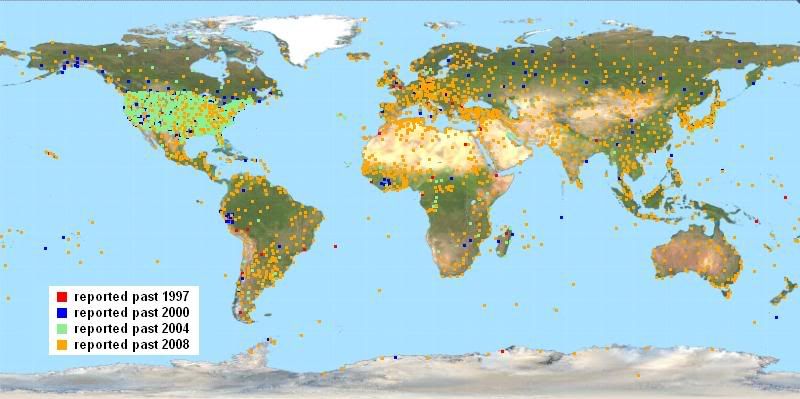
The below map shows all GHCN stations reporting at least one raw monthly mean temperature past 1997 (ie Jan 1998 or later). 3154 stations in total.


3091 stations report past 2000.

2773 report past 2004.

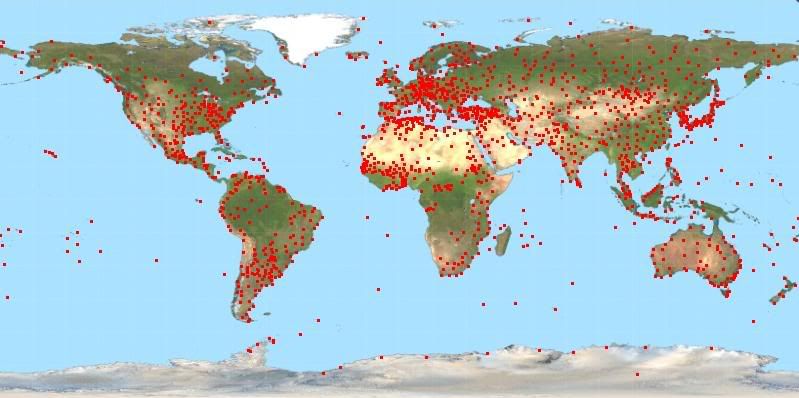
Here are the stations that have reported data past 2008 (at least one month of 2009 reported). 1596 in total:


Here is a map showing all the above mentioned years.

Monday, 1 February 2010

GHCN Color by Number

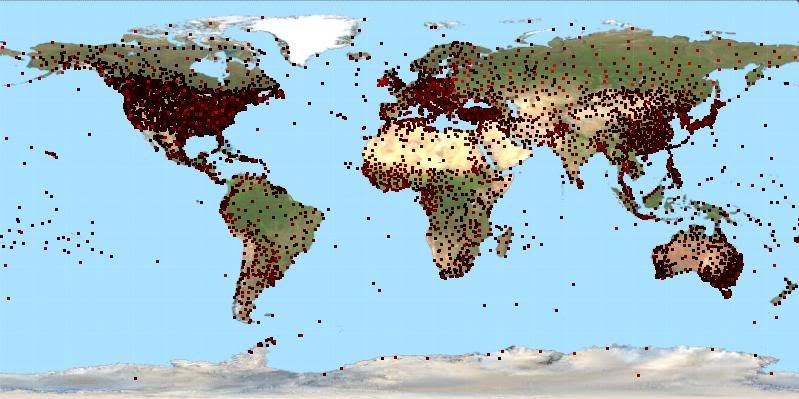
Below is a not particularly useful graph showing the number of raw duplicates each GHCN station has using the color red. The color for each station is a gradient from the darkest dots with 1 raw temperature record to the brightest red dots with 10.


The color difference is so slight and my jpgs get distorted so much it's not a particularly viewable graph. Also the dots overlap each other, especially in the US. When that happens the brighter dots win as they are drawn over the top of the darker dots. If this mattered for anything other than curiosity I would perhaps plot separate maps for each level.

It does appear even from this bad graphic that some regions of the world have stations with a lot of duplicates while other regions have stations with far fewer duplicates. Not surprising I suppose.

The numbers I got for raw records are:

1 record = 4574 stations
2 records = 1109 stations
3 records = 601 stations
4 records = 502 stations
5 records = 271 stations
6 records = 114 stations
7 records = 57 stations
8 records = 39 stations
9 records = 11 stations
10 records = 2 stations (Irkutsk and Los Angeles for what it's worth)

It's not possible to have 11 duplicates in the file as the duplicates column is a single digit..

The numbers I got for adjusted records are:

0 records = 2509 stations (that's right, a lot of stations appear to only have raw data)
1 record = 3556 stations
2 records = 752 stations
3 records = 275 stations
4 records = 110 stations
5 records = 58 stations
6 records = 18 stations
7 records = 2 stations (Irkutsk again! and Sverdlovsk..wherever that is, I only know irkutsk from playing risk)

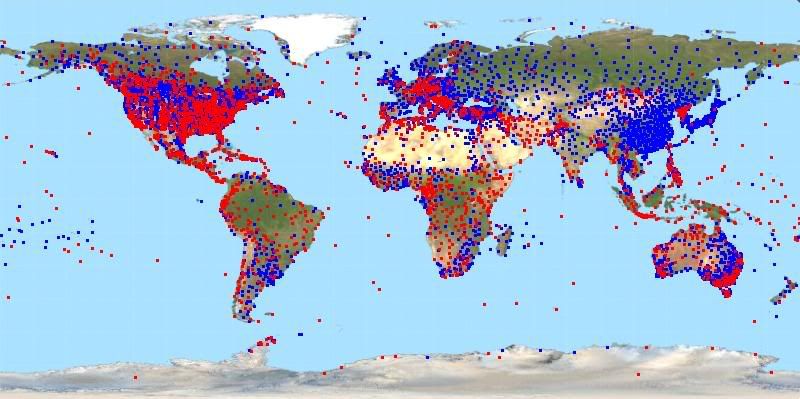
The graph this time is a bit more viewable. I plotted all stations with at least one adjusted record in blue and then over the top I plotted all stations with no adjusted records in red.


Today I compiled and store away station meta-data like number of raw and adjusted duplicates (which I used in this post) as well as the start and end dates of each record. I also have scope to add more such meta-data later. By "storing it away" I mean I have separated this info from the temperature data itself so I can load that information without loading all the actual temperature data. Will make queries on those things faster. Of course if I download an updated copy of the GHCN files I need to refresh the metadata files, but that's an infrequent task.

Next I need to add the ability to calculate linear trends over arbitrary periods. I also need to figure out how to handle duplicates in any analysis. Do I average them? Take a random duplicate? Exclude outliers? My thoughts are to try them all and see what difference it makes as I have no knowledge or basis to pick a particular strategy.