Looks like they are busy fixing problems. It was previously scheduled to launch on the 25th February.
"CryoSat 2 is first in the queue, but liftoff of the ice observation craft from Baikonur probably won't occur this month due to the late discovery of a performance issue with the Dnepr's second stage steering system."
http://www.spaceflightnow.com/news/n1003/10dnepr/
Thursday, 11 March 2010
Sunday, 7 March 2010
SMHI and Phil Jones
Stockholm Initiative Called Out Over False Accusations Against Phil Jones
Stockholm Initiative delivers false statement about parliament enquiry
http://climateaudit.org/2010/03/05/phil-jones-called-out-by-swedes-on-data-availability/
The false statement is not made by the SHMI, but a body calling itself the "Stockholm Initiative". This is important to note, because the way it has been presented on certain blogs has mislead some people into thinking the false statement, with it's rather colorful phrasing, was made by the SHMI itself or another neutral Swedish science organization.
The press release containing the false statement actually comes from a body calling itself the "Stockholm Initiative" (Take a look at their website). Comparisons could be made with the Heartland Institute, although the Stockholm Initiative seems slightly more credible.
The opening words of the Stockholm Initiative press release contains a false statement attributing a statement to Phil Jones that he did not make. It wasn't Phil Jones who mentioned the data availability issue with the SHMI, it was the Professor Acton who was present alongside Phil Jones the parliamentary hearing (see the transcript of the hearing - http://www.publications.parliament.uk/pa/cm200910/cmselect/cmsctech/uc387-i/uc38702.htm). This is a very strange and disturbing kind of error given that the transcript is very clear on who said what.
This is not the only error however. The following blog post outlines "many factual errors" that are contained in the SHMI press release:
Climate sceptics are wrong about Phil Jones and SMHI
This press-release have gained considerable attention on climate denier blogs but contains many factual errors. To begin with swedish data is not in the public domain. SMHI have recently made some data available on the internet for non commercial use, but under the explicit condition that the recipient is not allowed to disclose the data.
The license agreement is very easy to find, and if you are able to read swedish the license agreement can be read here. Paragraphs §3.2 and 4.1 are the relevant ones and here's a rough translation of §4.1
4.1 The Licensee does not own the right på disclose, send on, link to or in any other way spread the contents of the data and/or products that has been recieved in accordance with this agreement to a third part.
This is not public domain.
But it is however standard policy for SMHI, and for most of the european wheather organisations. There are even some sort of common guidelines for this sort of thing. The SMHI and others are allowing scientists free access to their data, but they are not allowed to re-publish the data.
See also http://scienceblogs.com/stoat/2010/03/weird_stuff_from_the_swedes.php)
The Stockholm Initiative have not commented and clarified a response to their errors or explained how they came about. I only hope they step forward to clear matters up, or else I fear the world will not trust anything they say again. This is of course a very important subject and it would be a shame to see the reputation of such fine organizations as the Stockholm Initiative tarnished..
Saturday, 6 March 2010
Test Cases
Any method to solve the problems of duplicate combination and homogenization of stations has to deal with any number of odd situations (3-way overlaps, gaps in records, spurious jumps, false trends, poor spacial coverage). I think I will approach GHCN analysis by producing a number of test cases which a method can be run against. The benefit of test data is you can know the ideal result and therefore can quantify the accuracy of the method in it's attempt to reproduce that result.
I got the idea from here:
http://treesfortheforest.wordpress.com/2010/02/10/methods-to-combine-station-data/
For example to produce a test case for the problem of duplicate merging, start off with an auto-generated ideal temperature record, clone it N times and damage those N clones in various ways (gaps, spurious trends, step changes, etc). Any method for duplicate-merging could then be tested against these N duplicate records to see how well it can reproduce the ideal temperature record. This can also be done for homogenization and other problems.
It would be nice to have a whole load of such test cases that can be run against different methods, both to verify that they don't make gross errors in certain cases, and to compare how well they do with other methods.
Below is a simple example of how a test case helped me spot a problem with my method for calculating the temperature trend of a record. Sorry to say I had assumed the slope of line of best fit through monthly data represented the temperature trend of that data.
For the test case I created a 100 year long test record spanning from January 1900 to December 2000. I intentionally designed the record so it would have an annual cycle but no longterm warming or cooling trend. So the data itself is just a sine wave around 10 degrees C. Any method that determines warming trends should find no warming trend in this record. Here is the first 5 years of the test data:
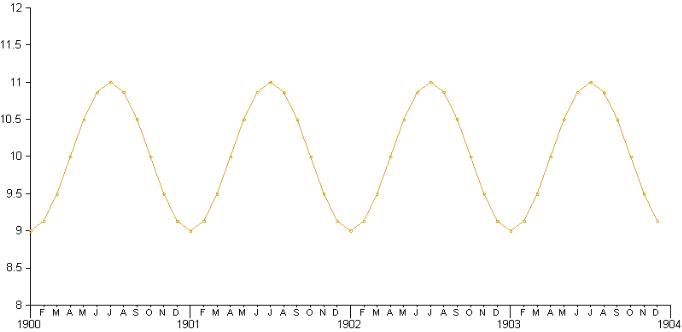
When I applied my slope of line of best fit method to this data, I found a warming trend of -0.002C/decade, or -0.02C over the entire 100 years.
I was surprised and thought I had an error in my linear trend calculation, I fully expected a full sine wave cycle to have zero trend. Glad I didn't trust my intuition. I checked against a few online linear regression applets and got the same result, so the calculation is fine. I now realize I could have figured this out faster using the the woodfortrees plotter.
If the annual cycle is 0C to 20C, instead of 9C to 11C, the cooling over the period is 0.2C! Even worse with just 50 years of data I get 0.075C/decade cooling. Overall that adds up to 0.375C cooling over the entire period. But of course there has been no such cooling in this test record, so the idea that sticking a line of best fit slope through monthly data will show the warming trend is false.
Many other people will already know this. Chad warned me about it in a previous post:
"One minor nitpick- I think you should convert to anomalies for the trend analysis. There might be some end point effects because of the annual cycle. It's probably nothing to be worried about because the data spans such a large period."
I do notice a bodge, like if I take an 18 month period from the sine wave starting at a certain point, the trend is flat. But I don't understand all this so it's a better idea to abandon the idea altogether.
What I know will work is to compute the annual average for each year and derive the trend for that. In the test data that will give the correct 0C slope (also works here)
So moral of the story for me is - test cases are important! And also I will have to work on producing and graphing annual data after.
I got the idea from here:
http://treesfortheforest.wordpress.com/2010/02/10/methods-to-combine-station-data/
For example to produce a test case for the problem of duplicate merging, start off with an auto-generated ideal temperature record, clone it N times and damage those N clones in various ways (gaps, spurious trends, step changes, etc). Any method for duplicate-merging could then be tested against these N duplicate records to see how well it can reproduce the ideal temperature record. This can also be done for homogenization and other problems.
It would be nice to have a whole load of such test cases that can be run against different methods, both to verify that they don't make gross errors in certain cases, and to compare how well they do with other methods.
Below is a simple example of how a test case helped me spot a problem with my method for calculating the temperature trend of a record. Sorry to say I had assumed the slope of line of best fit through monthly data represented the temperature trend of that data.
For the test case I created a 100 year long test record spanning from January 1900 to December 2000. I intentionally designed the record so it would have an annual cycle but no longterm warming or cooling trend. So the data itself is just a sine wave around 10 degrees C. Any method that determines warming trends should find no warming trend in this record. Here is the first 5 years of the test data:
When I applied my slope of line of best fit method to this data, I found a warming trend of -0.002C/decade, or -0.02C over the entire 100 years.
I was surprised and thought I had an error in my linear trend calculation, I fully expected a full sine wave cycle to have zero trend. Glad I didn't trust my intuition. I checked against a few online linear regression applets and got the same result, so the calculation is fine. I now realize I could have figured this out faster using the the woodfortrees plotter.
If the annual cycle is 0C to 20C, instead of 9C to 11C, the cooling over the period is 0.2C! Even worse with just 50 years of data I get 0.075C/decade cooling. Overall that adds up to 0.375C cooling over the entire period. But of course there has been no such cooling in this test record, so the idea that sticking a line of best fit slope through monthly data will show the warming trend is false.
Many other people will already know this. Chad warned me about it in a previous post:
"One minor nitpick- I think you should convert to anomalies for the trend analysis. There might be some end point effects because of the annual cycle. It's probably nothing to be worried about because the data spans such a large period."
I do notice a bodge, like if I take an 18 month period from the sine wave starting at a certain point, the trend is flat. But I don't understand all this so it's a better idea to abandon the idea altogether.
What I know will work is to compute the annual average for each year and derive the trend for that. In the test data that will give the correct 0C slope (also works here)
So moral of the story for me is - test cases are important! And also I will have to work on producing and graphing annual data after.
Friday, 5 March 2010
UAH switches to v5.3
http://www.drroyspencer.com/2010/03/february-2010-uah-global-temperature-update-version-5-3-unveiled/
Oh man does this mean icecap.us is going to have to redo all their graphs?
For all those easily locatable "skeptics" who insisted that past recorded temperature should not be changed, adjustments should not be made, etc etc - their shields are down, go get em.
Oh man does this mean icecap.us is going to have to redo all their graphs?
For all those easily locatable "skeptics" who insisted that past recorded temperature should not be changed, adjustments should not be made, etc etc - their shields are down, go get em.
Wednesday, 3 March 2010
Stations reporting in the past ~month
I downloaded the latest GHCN raw mean data file to find that:
1306 Stations have reported January

328 Stations have reported February data already

1581 Stations have reported at least one month since February 2009:

1306 Stations have reported January
328 Stations have reported February data already
1581 Stations have reported at least one month since February 2009:
Tuesday, 2 March 2010
Contradictions
I was meaning to make this list for a while.
-Those darned climate scientists have deliberately fudged the surface temperature records so that they support manmade global warming!
-The early 20th century warming in the surface records disproves manmade global warming!
-Computers can be made to say anything! Those darned climate scientists have written the climate models so that the output supports manmade global warming!
-The climate models disprove manmade global warming because the output shows a hotspot that doesn't exist!
-The early 20th century warming in the surface records disproves manmade global warming!
-We can't believe the surface records. They are far too inaccurate!
-The ice core co2 records show co2 lags temperature, not the otherway round!
-The ice core co2 records are inaccurate due to co2 diffusing through the ice so we can't believe them!
-Low Climate Sensitivity!
-The Climate has changed a lot in the past!
-Mankind's resourcefulness and ingenuity will allow us to easily adapt to any change in climate or sea level
-A carbon tax will have a catastrophic effect on our economy and civilization
GHCN work continues...
The slow progress of GHCN analysis continues, nothing to show just tidying up some code. Have generated records for all stations using the simple duplicate merge method, but haven't done anything with them yet. Instead I decided to put in place the ability to add new duplicate merging methods without losing the older methods and associated data. That should make it easier to compare different methods later. Nothing to show from doing this kind of stuff, but it should make work faster in the longrun. I am generally slower than most people, I notice quite a few people seem to have produce GHCN raw results in a couple of days. A number of people have already reproduced Tamino's result (http://tamino.wordpress.com/2010/03/01/replication-not-repetition/) and I am going to be too late that that party anyway :( all the drinks will have gone. Nevermind, it is good because now if my results don't match everyone elses I will know I've almost definitely done something wrong.
Subscribe to:
Posts (Atom)