I got the idea from here:
http://treesfortheforest.wordpress.com/2010/02/10/methods-to-combine-station-data/
For example to produce a test case for the problem of duplicate merging, start off with an auto-generated ideal temperature record, clone it N times and damage those N clones in various ways (gaps, spurious trends, step changes, etc). Any method for duplicate-merging could then be tested against these N duplicate records to see how well it can reproduce the ideal temperature record. This can also be done for homogenization and other problems.
It would be nice to have a whole load of such test cases that can be run against different methods, both to verify that they don't make gross errors in certain cases, and to compare how well they do with other methods.
Below is a simple example of how a test case helped me spot a problem with my method for calculating the temperature trend of a record. Sorry to say I had assumed the slope of line of best fit through monthly data represented the temperature trend of that data.
For the test case I created a 100 year long test record spanning from January 1900 to December 2000. I intentionally designed the record so it would have an annual cycle but no longterm warming or cooling trend. So the data itself is just a sine wave around 10 degrees C. Any method that determines warming trends should find no warming trend in this record. Here is the first 5 years of the test data:
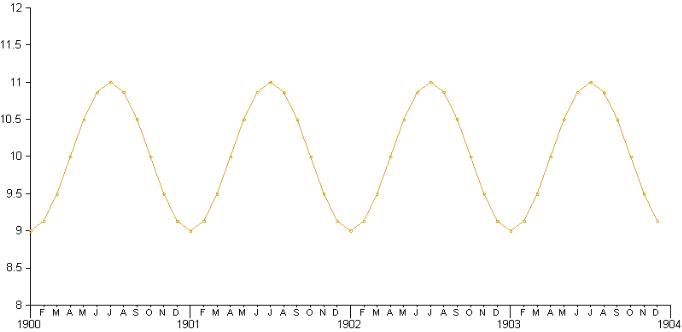
When I applied my slope of line of best fit method to this data, I found a warming trend of -0.002C/decade, or -0.02C over the entire 100 years.
I was surprised and thought I had an error in my linear trend calculation, I fully expected a full sine wave cycle to have zero trend. Glad I didn't trust my intuition. I checked against a few online linear regression applets and got the same result, so the calculation is fine. I now realize I could have figured this out faster using the the woodfortrees plotter.
If the annual cycle is 0C to 20C, instead of 9C to 11C, the cooling over the period is 0.2C! Even worse with just 50 years of data I get 0.075C/decade cooling. Overall that adds up to 0.375C cooling over the entire period. But of course there has been no such cooling in this test record, so the idea that sticking a line of best fit slope through monthly data will show the warming trend is false.
Many other people will already know this. Chad warned me about it in a previous post:
"One minor nitpick- I think you should convert to anomalies for the trend analysis. There might be some end point effects because of the annual cycle. It's probably nothing to be worried about because the data spans such a large period."
I do notice a bodge, like if I take an 18 month period from the sine wave starting at a certain point, the trend is flat. But I don't understand all this so it's a better idea to abandon the idea altogether.
What I know will work is to compute the annual average for each year and derive the trend for that. In the test data that will give the correct 0C slope (also works here)
So moral of the story for me is - test cases are important! And also I will have to work on producing and graphing annual data after.
I think the three topics of combining duplicates with the same station ID, combining different stations in the same grid box, and homogenising should be kept clearly separate, for clarity.
ReplyDeleteThe different station combining methods Chad was looking at aren't supposed to detect and remove spurious trends; that's the job of a separate homogenisation step.
Are there really any duplicates that show markedly different trends, over the period where they overlap?
I found a warming trend of -0.002C/decade, or -0.02C over the entire 100 years
ReplyDeleteDid you mean to say +0.02C?
No. But I think I know what you mean - the image doesn't correspond to the slope reported. At the time of making the image I was adjusting the phase of the wave so winter fell in Dec-Jan-Feb. I later removed that adjustment as pointless before calculating the slope, but forgot to update the graph image...
ReplyDeleteGreat post thankyoou
ReplyDelete